Visualisation User Interface
TIPP contains multiple visualisation plugins which are all based on the same principle: display window accompanied by a control window. Below is an explanation of how the simplest plugin (display) works. For more information refer to the ‘Included Plugins’, which can be opened by either opening it through the ‘Display Image’ plugin or by right clicking (a) file(s) and selecting the ‘Display’ option.
The interface consists of two components, a controller and a displayer.
The Control Window
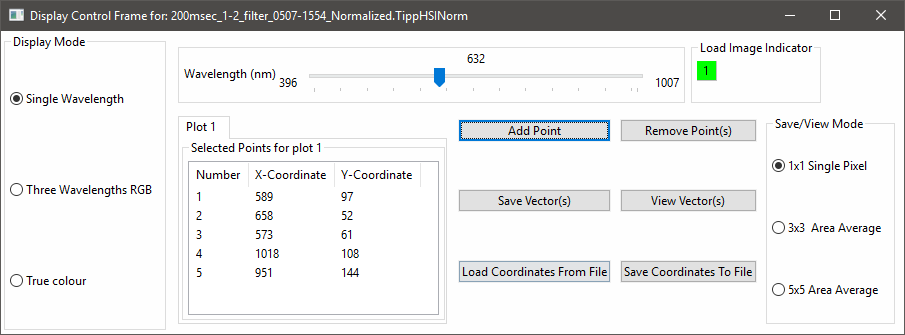
In the controller window there are a series of options as can be seen in the images below. In the next paragraphs the functions of the control window are explained.
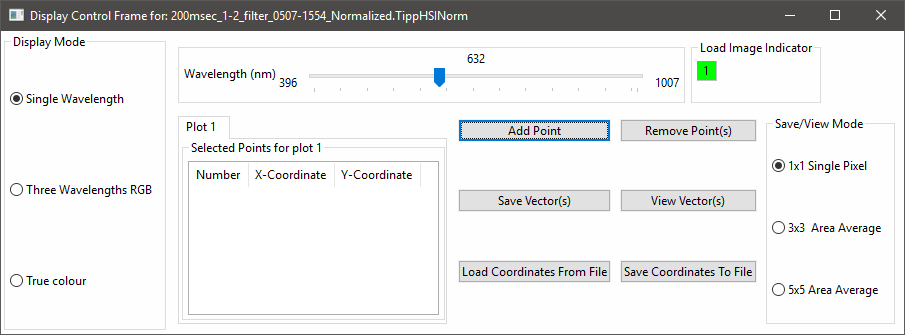
Display Mode
By changing the display mode, the visualiser will change the type of image displayed:
- Single Wavelength will show a grey-scale of a single wavelength.
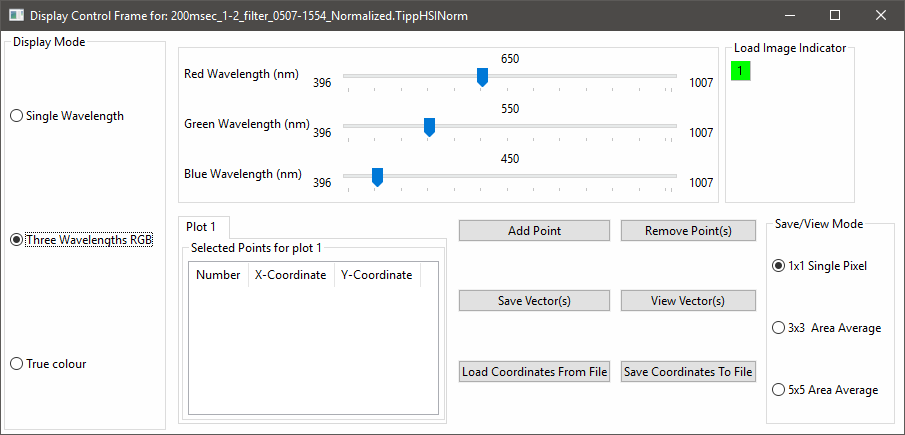
- RGB will show a constructed image from three separate wavelengths.
- True Colour will show a true colour representation of the image with reference to the average human-eye-cone absorption characteristics. (The true colour option is currently not working completely, since we are not taking in acount the transmision characteristics of the human-eye-optics and is not representative of the real sample)
Wavelength Slider
By moving the wavelength slider you change the currently displayed wavelength in the display window. In RGB mode there are three sliders to select the desired combination by the user, as seen in the image below.
Load Image Indicator
This indicator will turn green when the image that is currently being displayed corresponds to the wavelength selected in the slider. If the indicator is red it means that the displayer has not completed the display of the related to the wavelength slider image yet and is still performing calculations. Load image indicator will have multiple values based on the number of selected for display image sets.
Selected points
The selected points window will contain a series of tabs depending on how many image sets are opened simultaneously. In this window the coordinates of the selected points can be found. When one or more points are selected, the buttons to the right can be used.
Save/View mode
The Save/View mode will take in acount the number of neighborhood vectors that will be used in calculations. If 1x1 is selected, only a single pixel is taken in account (the selected point), however if 3x3 or 5x5 is used an average of the vectors from the neighborhood pixels surrounding the selected point is calclated.
The Display Window
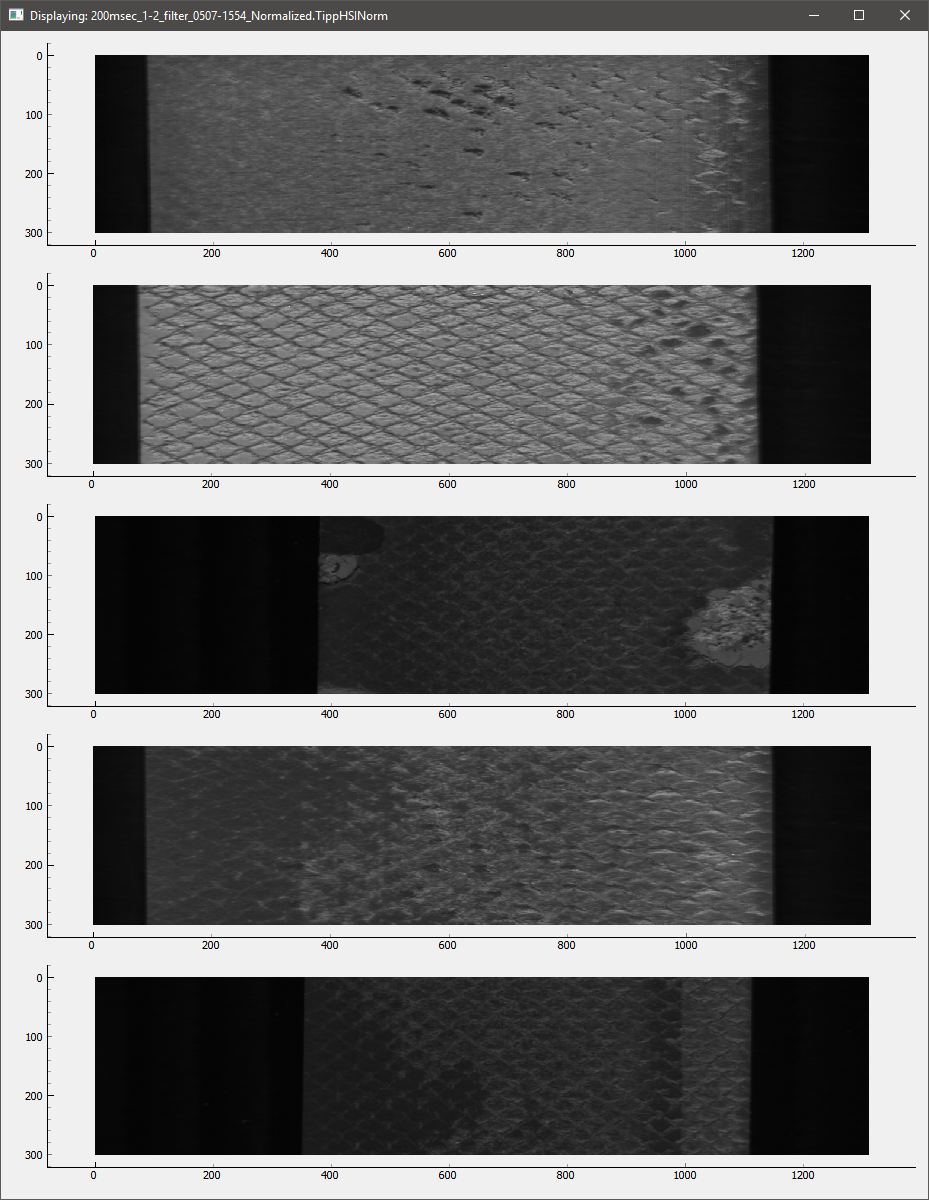
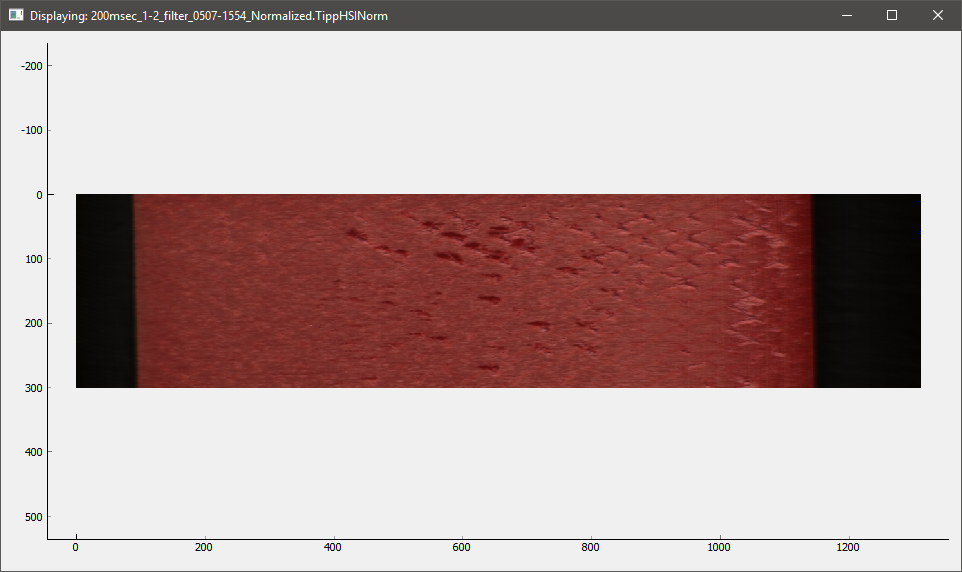
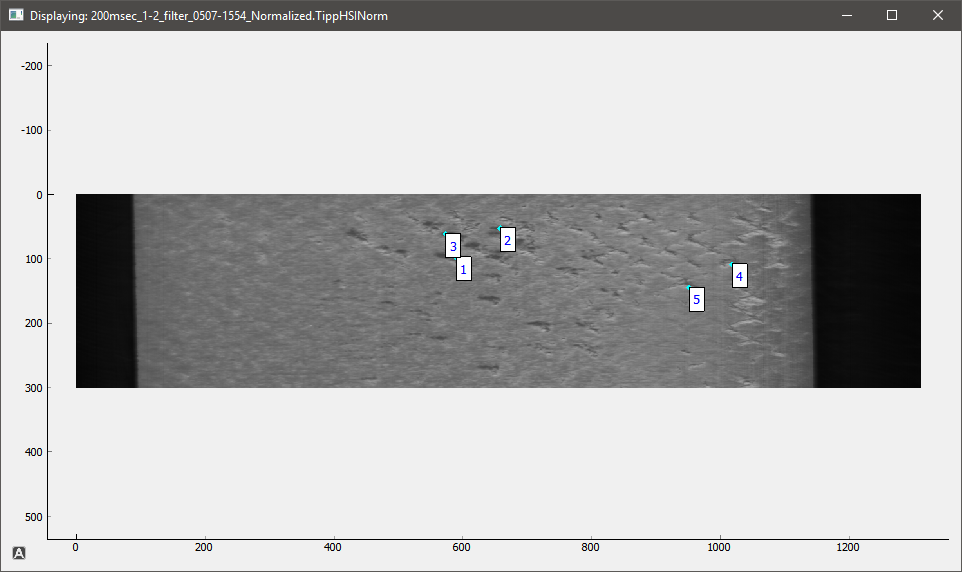
The displayer contains the image(s) that are selected to be displayed see images below. Points can be selected by left-clicking on the displayed image and points can be removed by middle mouse clicking on them. Right-clicking will open a context menu where the user can perform a series of actions, including saving the image to a file. (exporting)
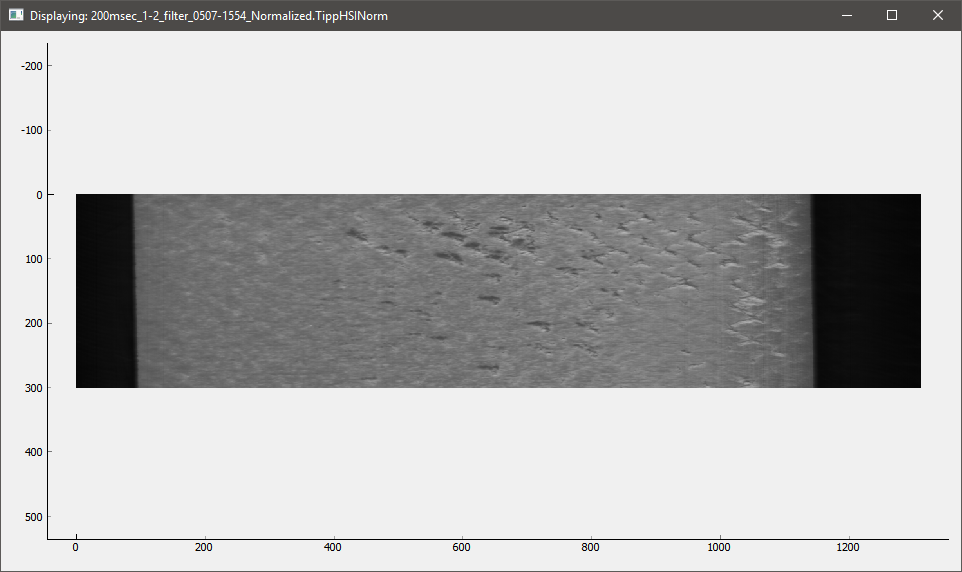
When points are selected they will appear in both the controller and the displayer as shown in the following picture.
It is also possible to open up multiple images at the same time, after which the displayer will look as follows:
