Display Image
The standard display plugin is the typical example of how TIPP handles visualisation windows. Below is a User Guide and a description of the inner workings.
User Guide
The Display image plugin can be opened by either opening it through the ‘Display Image’ plugin or by right clicking (a) file(s) and selecting the ‘Display’ option.
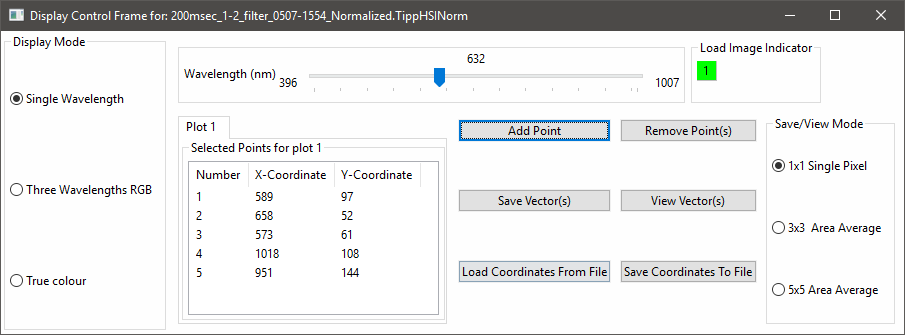
The interface consists of two components, a controller and a displayer. First the controller:
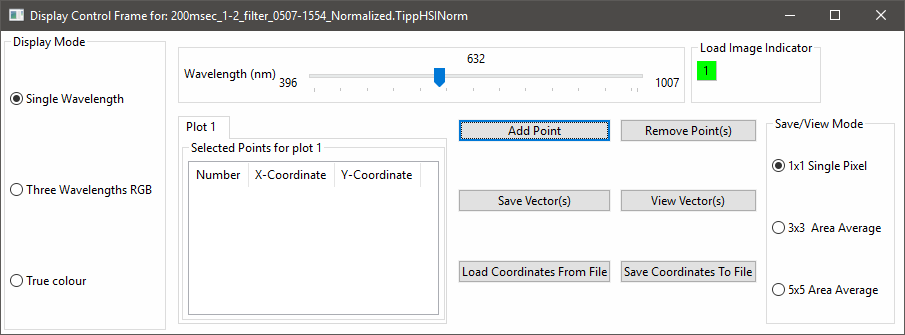
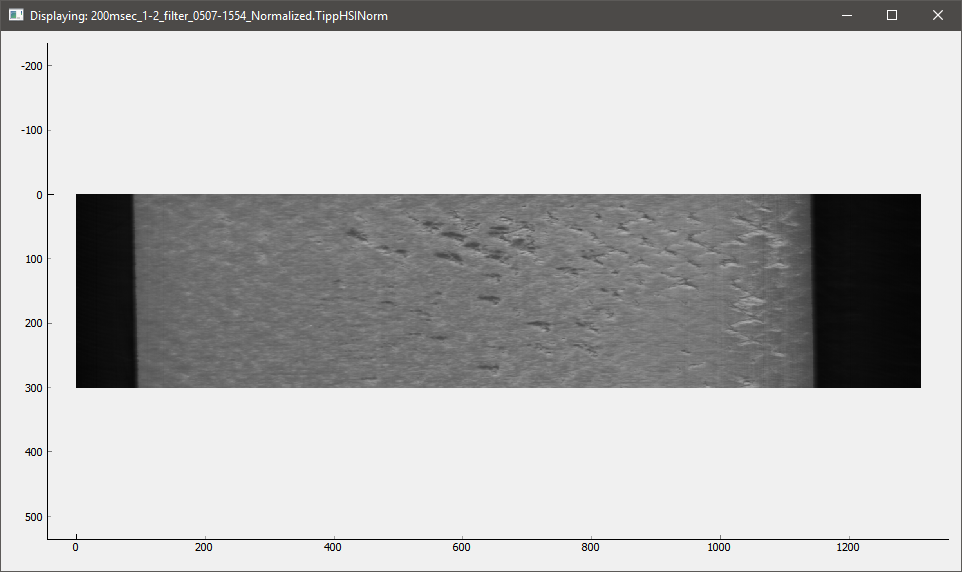
In the control window there are a series of options.
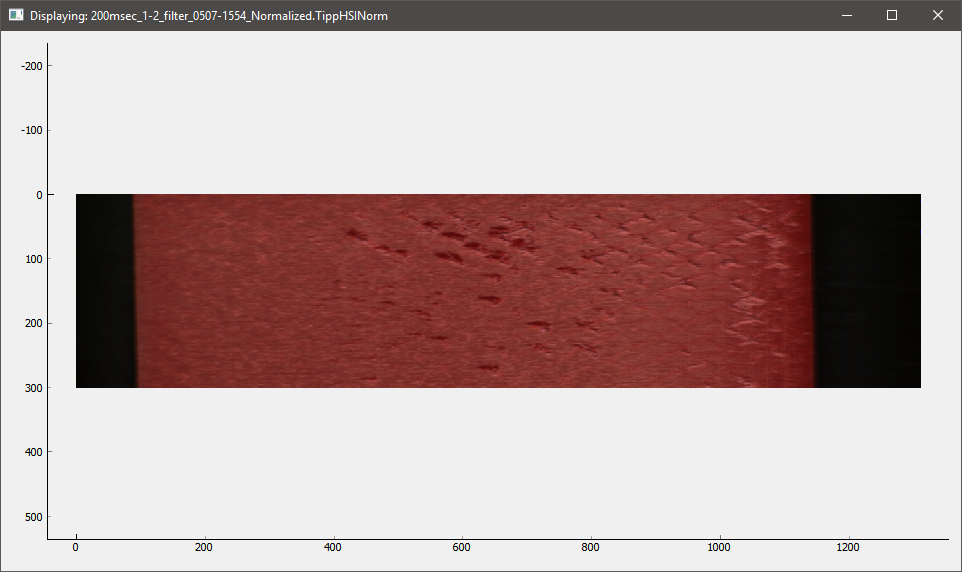
- Display Mode. By changing the display mode a signal is sent to the visualiser which will change the type of image displayed. Single Wavelength will show a grey-scale of a single wavelength. RGB will show a constructed image from three separate wavelengths. True Colour will show a true colour representation of the image where a curve is used to mimic human eyesight. (The true colour option is currently not working properly due to missing data and is not representative of the real sample)
- Wavelength Slider. By moving the wavelength slider you change the currently displayed wavelength in the display window. In RGB mode there are three sliders as seen in the image below.
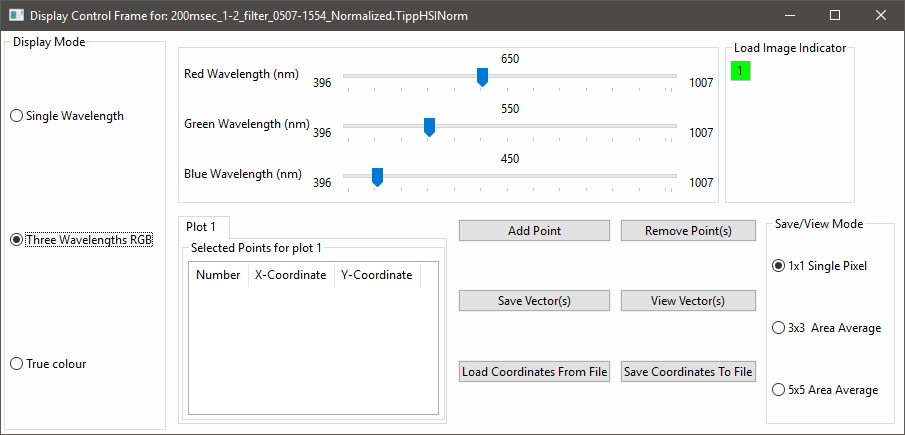
- Load Image Indicator. This indicator will be green if the image that is currently being displayed corresponds to the wavelength selected in the slider. If it is red it means that the displayer has not caught up to the slider movement yet and is still performing calculations.
- Selected points. The selected points window will contain a series of tabs depending on how many images are openes simultaneously. In this window the coordinates of selected points can be seen. These points are selectable and the options to the right can be used.
- Save/View Mode. The Save/View mode will determine for any of the options (eg. View Vector(s)) what will be used. If 1x1 is used only a single pixel is taken (the selected point) however if 3x3 or 5x5 is used an average of the pixels surrounding the selected point is taken.
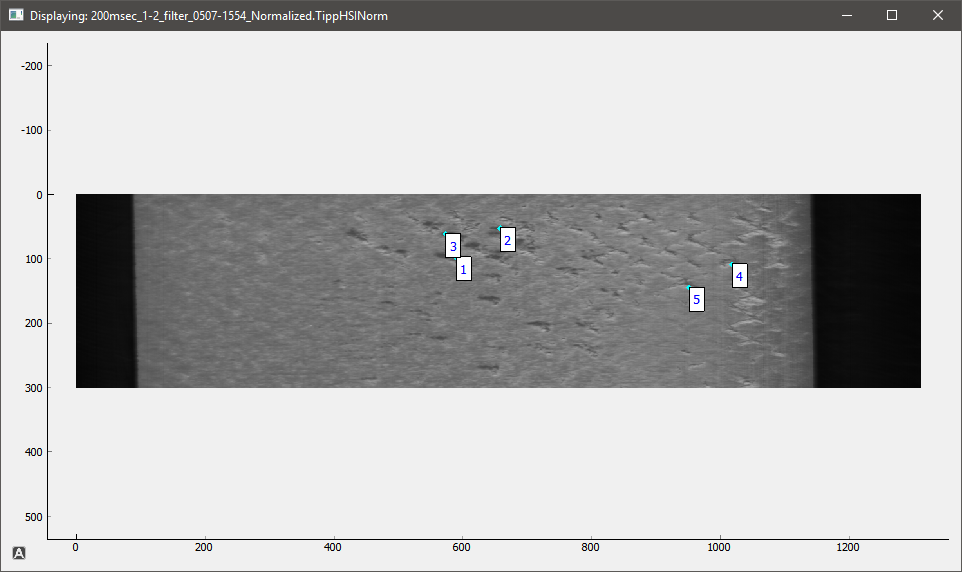
The displayer will contain the image(s) that are being displayed. In this displayer points can be selected by left-clicking and points can be removed by middle mouse clicking on them. Right-clicking will open a context menu where the user can perform a series of actions, including saving the image output to a file. (export)
When points are selected they will show up in the controller and in the displayer. This can be seen below.
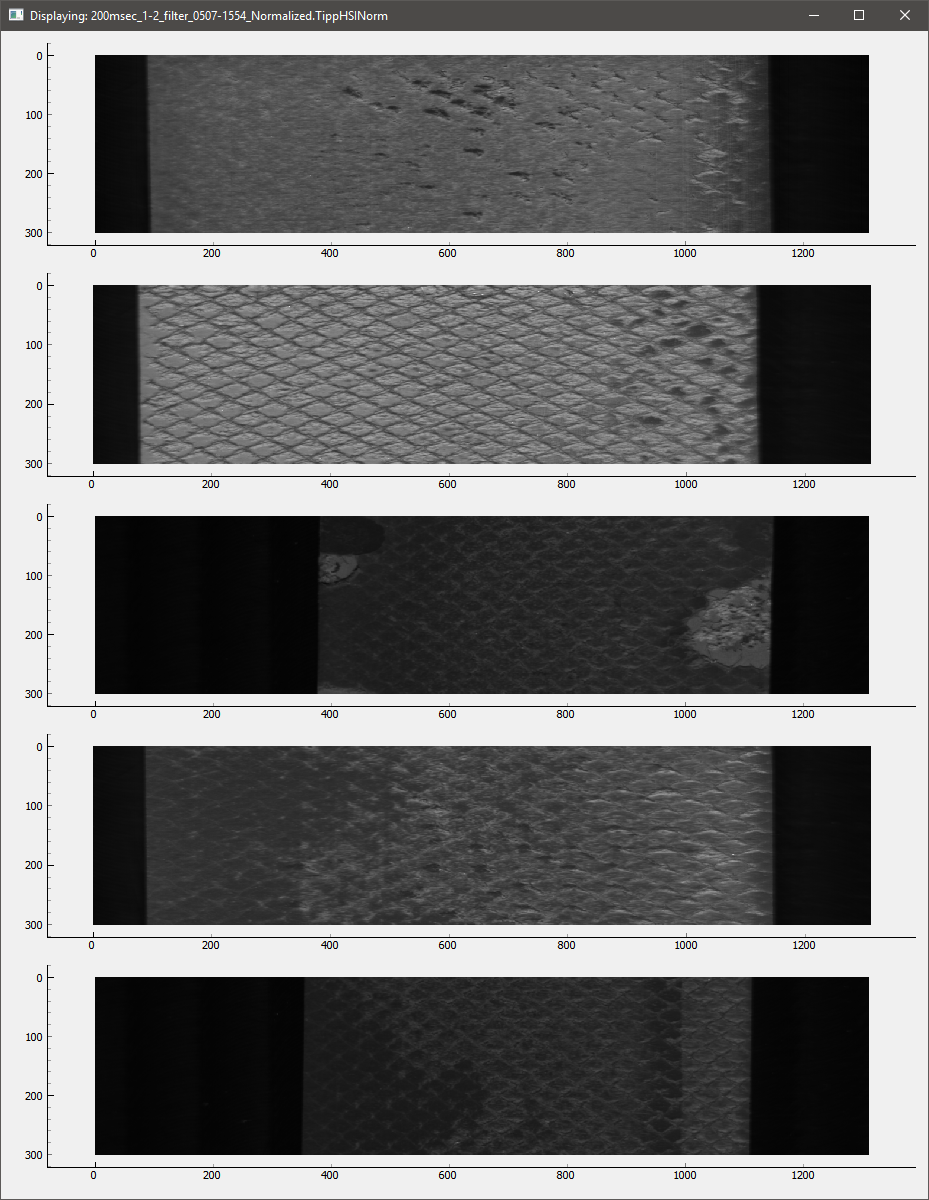
It is also possible to open up multiple images at the same time, after which the displayer will look as follows:
Inner Workings
The inner workings of the visalisation module are relatively complex. The system is based on two windows, the controller and the displayer.
The controller is merely there to send commands to the displayer. These commands are then interpreted by the displayer which will perform the bound function.
The displayer when initiated will use the pyqtgraph plugin to draw a window. During this period it will also set up all the information for all the files in the displayer to be used later on.
After the initialisation of the window is finished the displayer will spawn x additional python instances where x is variable depending on the number of CPU cores the user has given to TIPP in the settings.
The system works by looking at the current position of the wavelength slider and calculates a certain range of caches around this value. The size of this cache depends on the amount of memory allocated to TIPP. These caches will guarantee smooth scrolling trough the image (after they have been calculated) and vastly improve the user experience when compared to on-the-fly calculation of the required wavelength(s).
These x python instances will IDLE until they are given a task. This task is provided by the Update Thread that is executed in the main python interpreter. This thread will perform 3 basic actions in succession.
- See if any user input has been given that needs to be processed.
- See if this new user input requires a different set of caches that need to be calculated. It will then update a shared list with the external interpreters from which they will grab their tasks.
- See if any of the required caches for display purposes are finished. If they are they will be displayed and will show up to the user as output.
For a more in-depth look into all available functions please see the developer manual.