Principal Component Analysis
The principal component analysis plugin is a plugin which developments started with group D2 at the AE2223-I project of 2015/2016 and was finished by the lead developers of TIPP. The plugin can take a normalised image and use principal component analysis combined with a k-means clustering algorithm to map the surface into area’s that have similar properties.
Theory
PCA consist out of two main algorithms, principal component analysis and k-means clustering. The idea of principal component analysis is to compress the data for fast analysis and to make it suitable for k-means clustering. Both algorithms only work with 2D data, there for the first step is to transform the 3D images (x,y,lambda) to 2D dataset (point,data). The last step of the algorithm is then to transform it back to an images.
Principal component analysis is a matrix transformation. The result of the transformation is a new matrix with a decreasing standard deviation in the second axis. The transformation matrix is constructed in three steps:
- Normalise the dataset by taking the mean in the first axis.
- Take the covariance of this normalised dataset.
- Calculated the eigenvector of the covariance.
When multiplying the dataset with the transformation matrix the shape of the matrix stays the same. The next step is to compress the data, because the standard deviation is decreasing in the second axis there is only valuable information in approximate the first 10% of the second axis depending on the dataset. This means that with a minor loss of information the rest of the second axis can be removed.
Now there are two option stop here and save the PCA or cluster the PCA. Many clustering methods are available and can be done when choosing to cluster. K-means is chosen for three reasons. It is fast, a centroid model and good after principal component analysis. The basic idea of K-means clustering is as follows an x number of cluster centroids are chosen, then the points are placed in the cluster with the smallest distance to that cluster centroid. The next step is to recalculate the centroids. Redo these steps until the cluster centroids stabilise. So a centroid model is good because points that are close together are probably the same and K-means uses distance so it is better to have a dataset that is based on standard deviation.
When using this plugin there are a few extras that can be used next to the basic algorithm:
- In this K-means algorithm the initial clusters and centroids are not randomly selected but the data set is sorted on one of the principle components and then made in cluster of equal size. This is done to speeds up the algorithm.
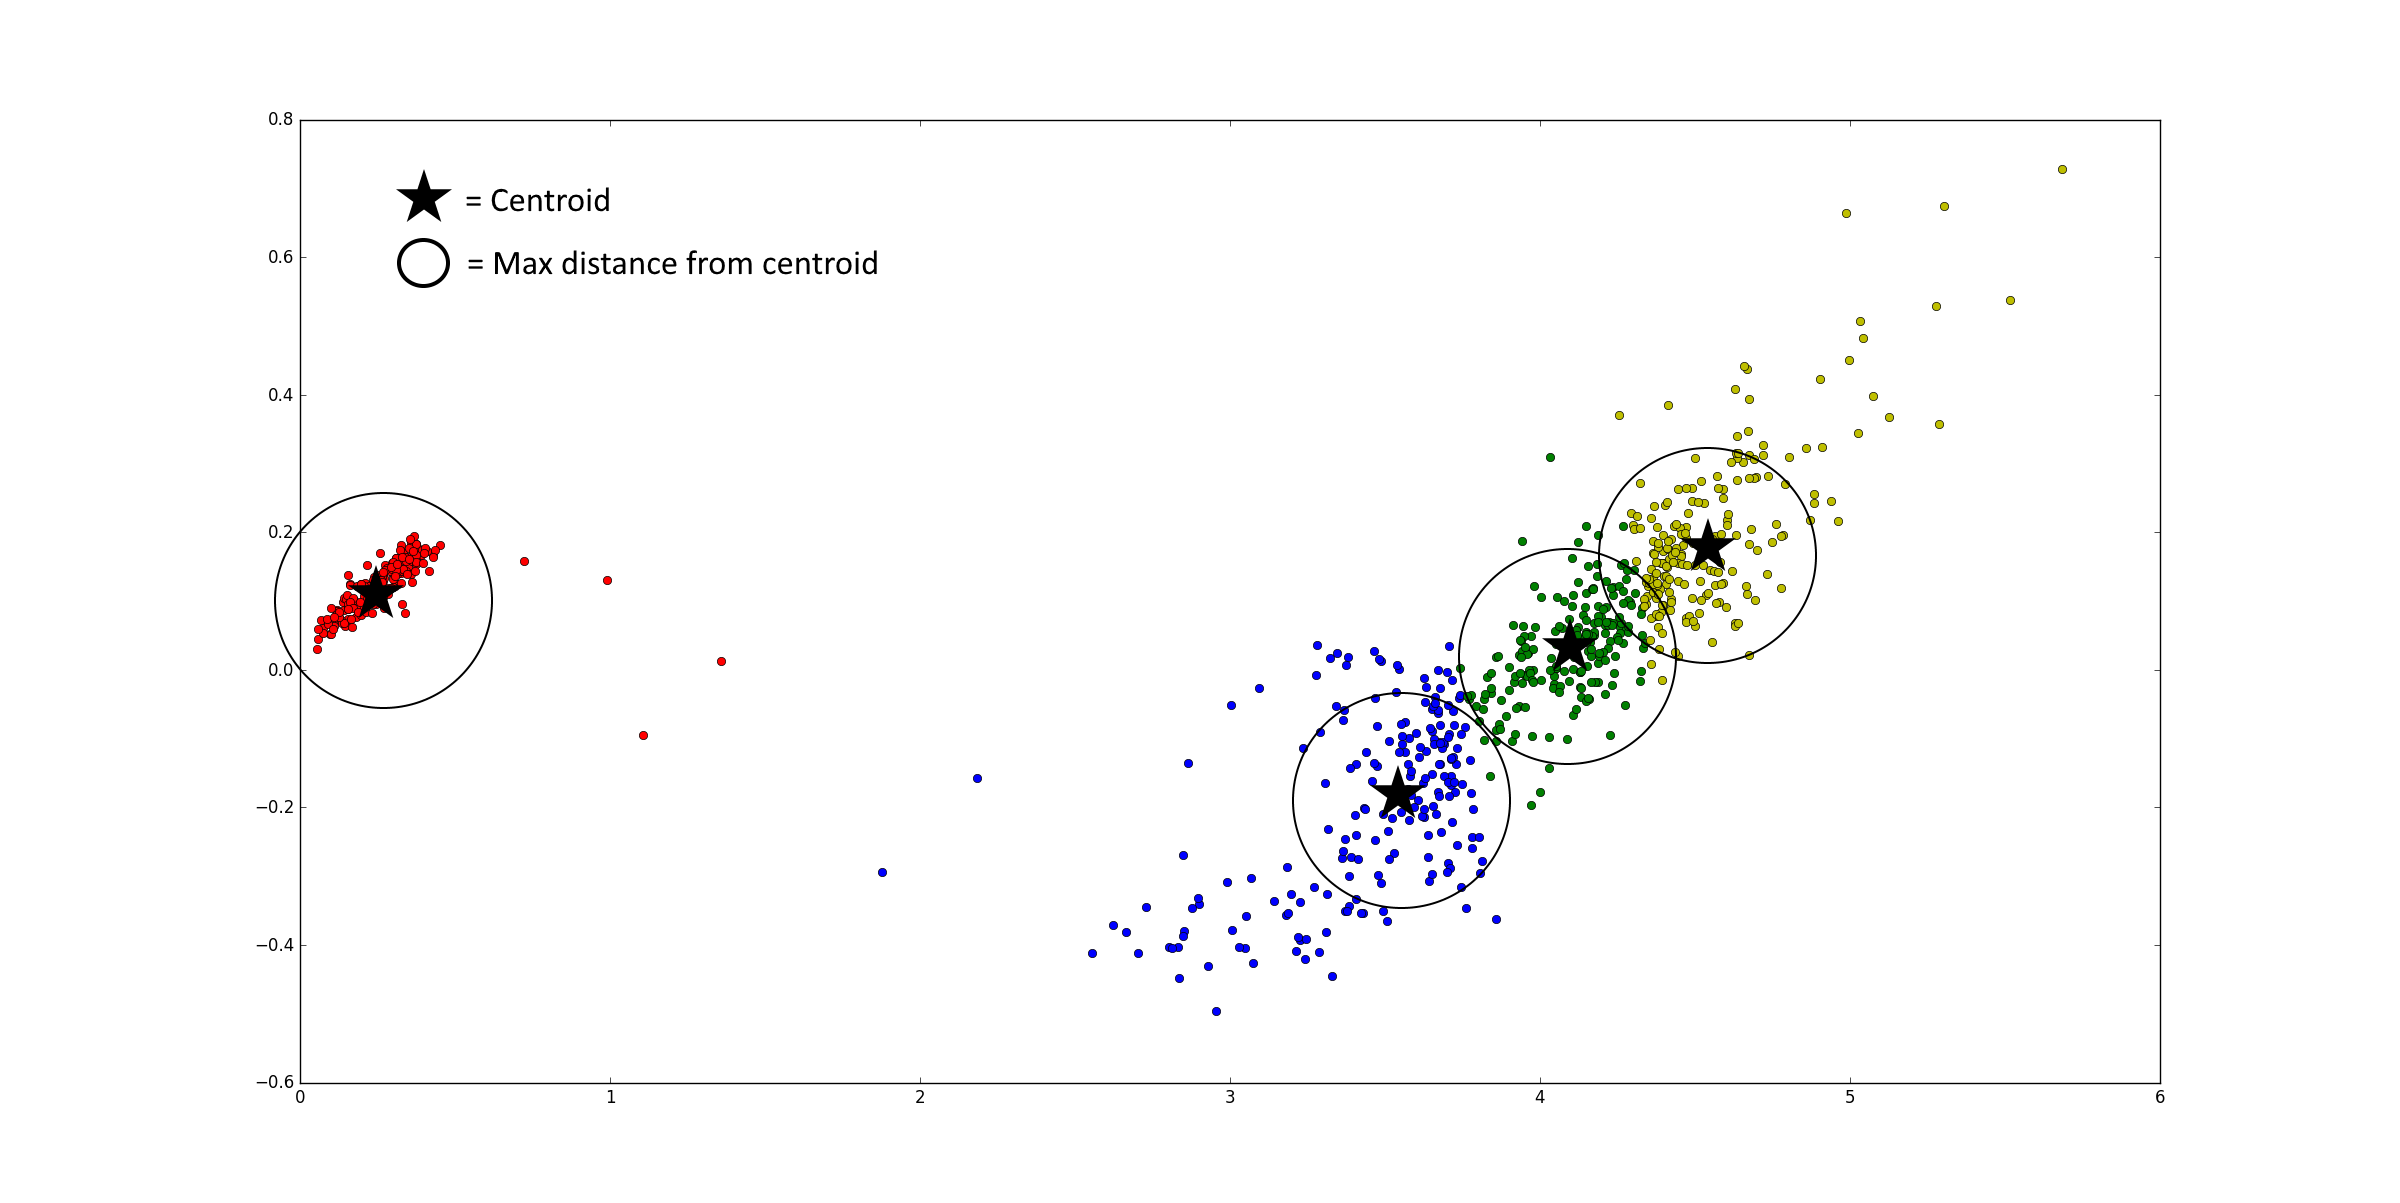
- Use a max distance to exclude points that are further away from the cluster centroid. An example with two principle components is given below. This feature includes also a min cluster size to remove clusters that do not have a dense centroid but are just a selection of spread out data points. The idea is that spread out data point clusters become small after removing the points that are more than the max distance away and then get removed by the min cluster size feature.

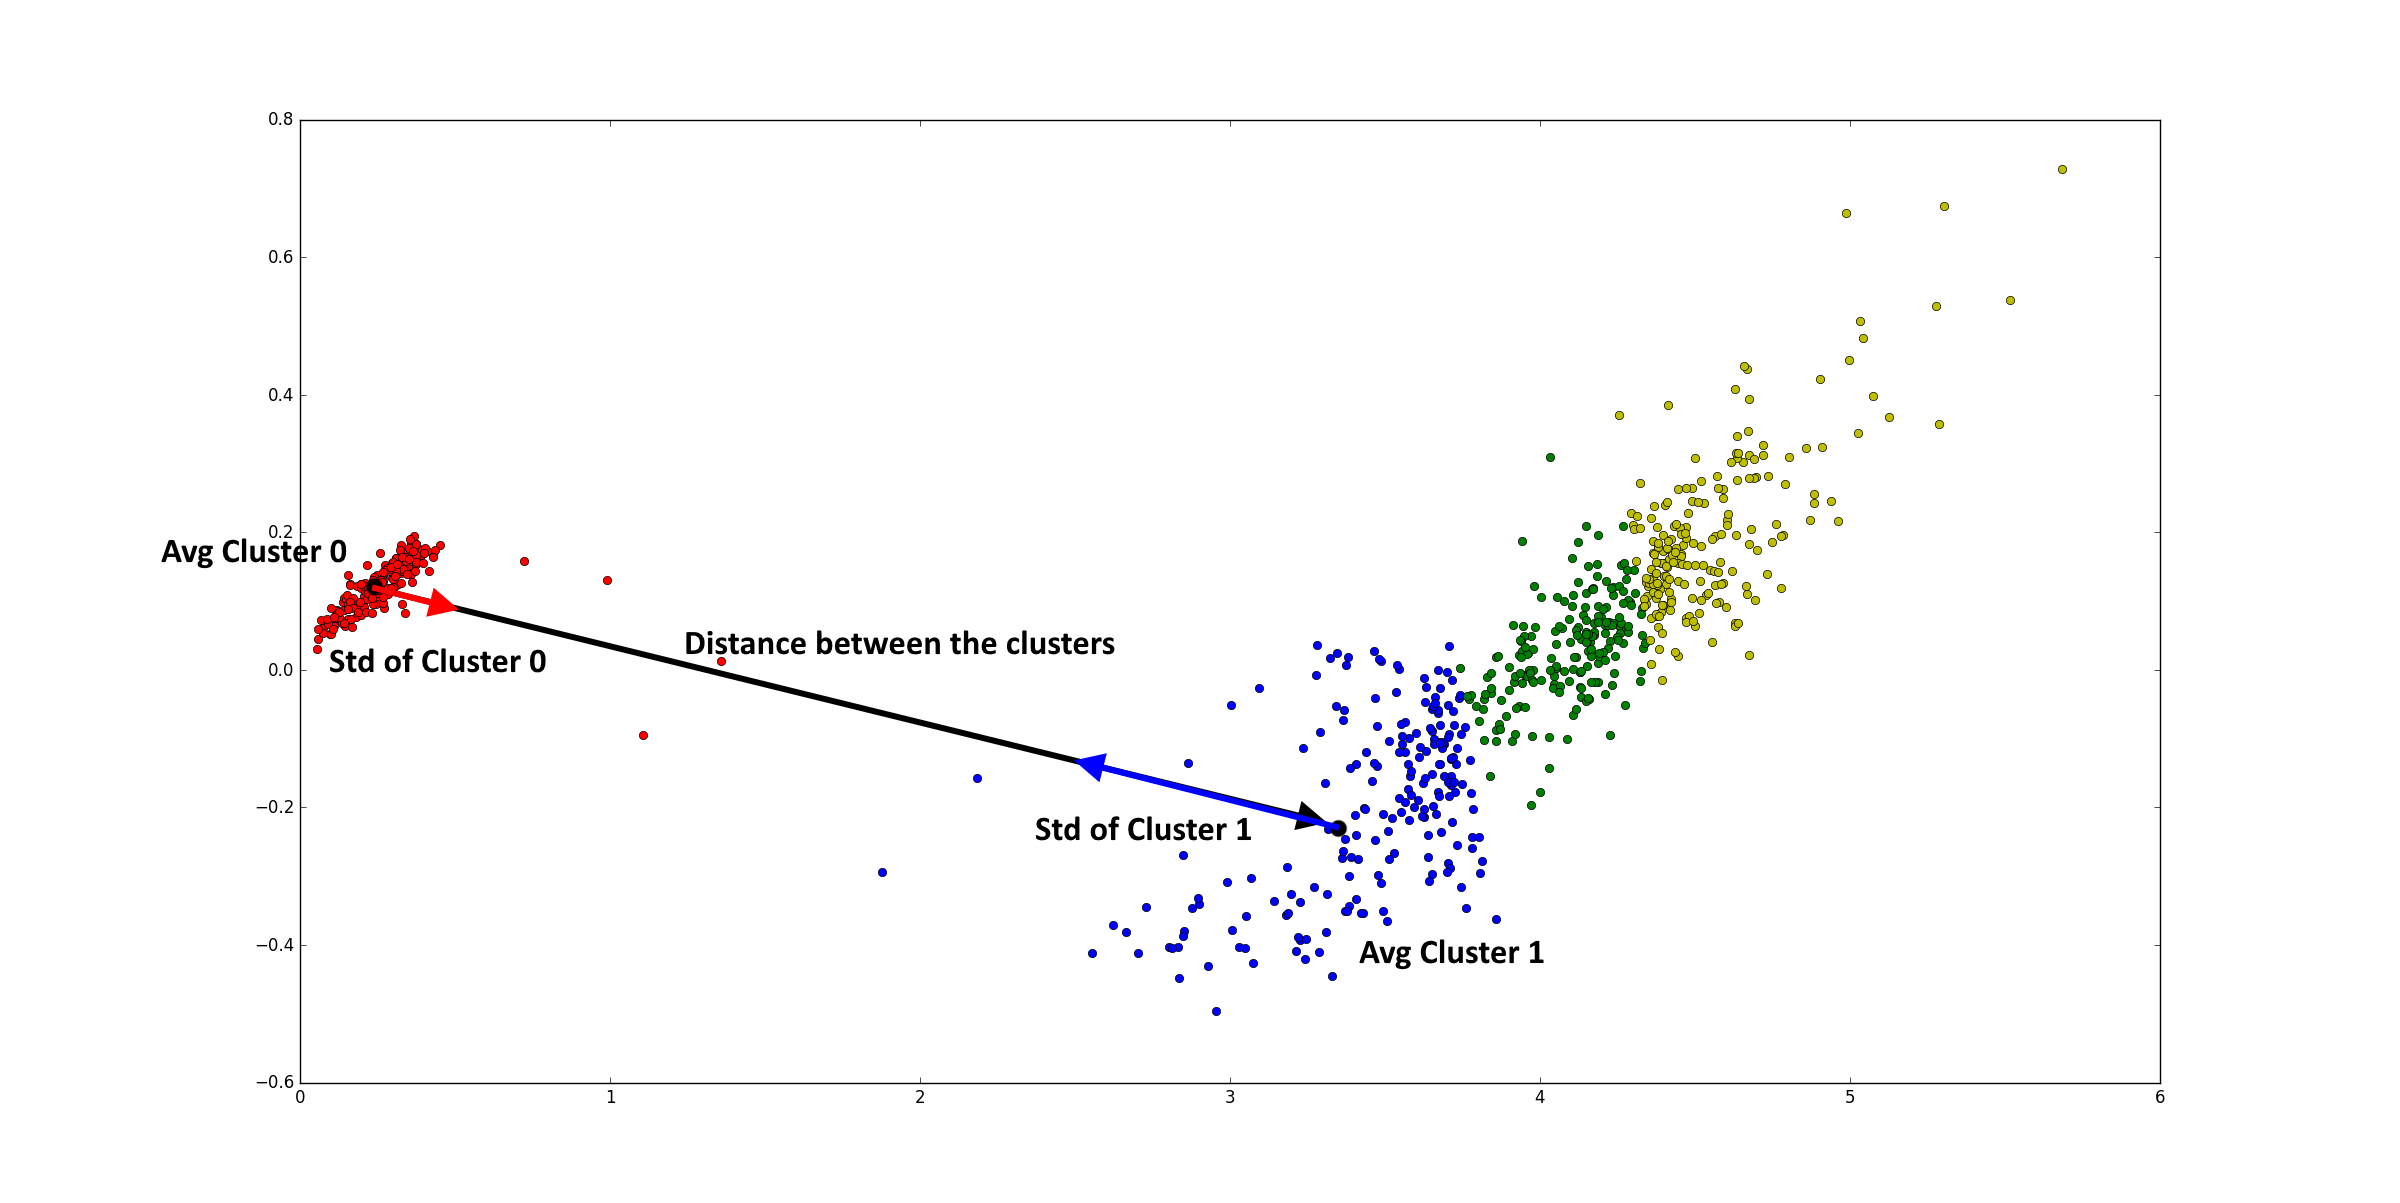
- Combining clusters is based on the fact that, if the distance between two cluster centroids is smaller than x times standard deviation of the first cluster plus x times the standard deviation of the second cluster, the two cluster are actually the same cluster. The standard deviations are calculated along the line between the two centroids. An example with two principle components is given below. The variable x allows to change the distance needed between cluster and is in the plugin called similarity needed between clusters.

Using the plugin
- Load the plugin by selecting a normalised image (.TippHSINorm).
- Fill in the filename and choose a method. Next fill in all the parameters that belong with that method and at last choose the number of iterations. (The algorithm will always converge, but if faster is more important than precise a fix number of iterations can be used.)
- Run the algorithm and the output is saved and can be visualised with the normal visualisation plugin or the heatmap plugin.
Remarks
If the user only uses principal component analysis and displays the first three principal components it is possible to manual find similar areas in the image based on colour.