Reference Component Analysis
The reference component analysis plugin is a plugin that is under continuous development by the main TIPP developers. The aim of the plugin is to use a method of reference component analysis to map reference vectors across the surface of a hyper spectral imaging sample.
Theory
Since there are various algorithms that can be used to perform referance component analysis the user is presented with a series of options.

The reference component analysis makes use of a non-negative least squares regression algorithm to map selected reference vectors to the selected image. The output is a weight array that will show for every pixel how much of that vector corresponds to a certain reference vector.
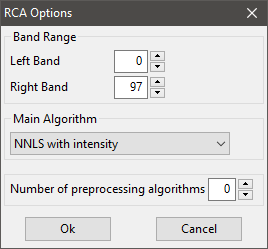
The settings that can be modified are as follows:
- The band range can be set, which basically means how many of the bands are used. By default it will show the full band range. If you only want to use the first 40% of the wavelength range for example adjust the bands accordingly. This helps if there are only differences between reference vectors in certain ranges of the spectrum.
- The main algorithm can be set and currently there are two options. Intensity and Differential. In the intensity mode the absolute values of the array will be used to perform the RCA. If differential (derivative of intensity) is used the derivative is used.
- The number of preprocessing algorithms can be used to improve the accuracy. During the preprocessing the NNLS algorithm is performed and the array is inspected after it. During this inspection it will be determined of enough (above the threshold) of a reference vector is present in a pixel to deem it ‘actually there’. If it is below the threshold value this vector is ommitted for the next preproccesing algorithm or the final algorithm. This is used to filter out some noise that is generated when the algorithm tries to fill up the ‘last’ part of a curve with a completely unrelated vector.
Using the plugin
- Load up the plugin by selecting the reference vectors you want to use and the normalised image.
- Set the settings as you please.
3. Run the algorithm and the output is saved and can be visualised with the heatmap visualisation plugin.